THE STATE OF

usage-based
pricing OpenView From Line

Usage-based pricing (UBP) has taken the SaaS world by storm. But with changing macroeconomic conditions, how will usage-based models continue to evolve and endure?

Authors: Kyle Poyar, Sanjiv Kalevar, Curt Townshend
Download the Report Backhand index pointing down


61%

SaaS companies used some
form of UBP in 2022.


SEE THE TREND


40+

The number of SaaS companies
emerging in the modern
pricing tech stack.

LEARN MORE


+38%

Usage-based public companies
have higher forecasted YoY
revenue growth than non-UBP peers.

COMPARE NUMBERS

Who we surveyedPencil emoji-1

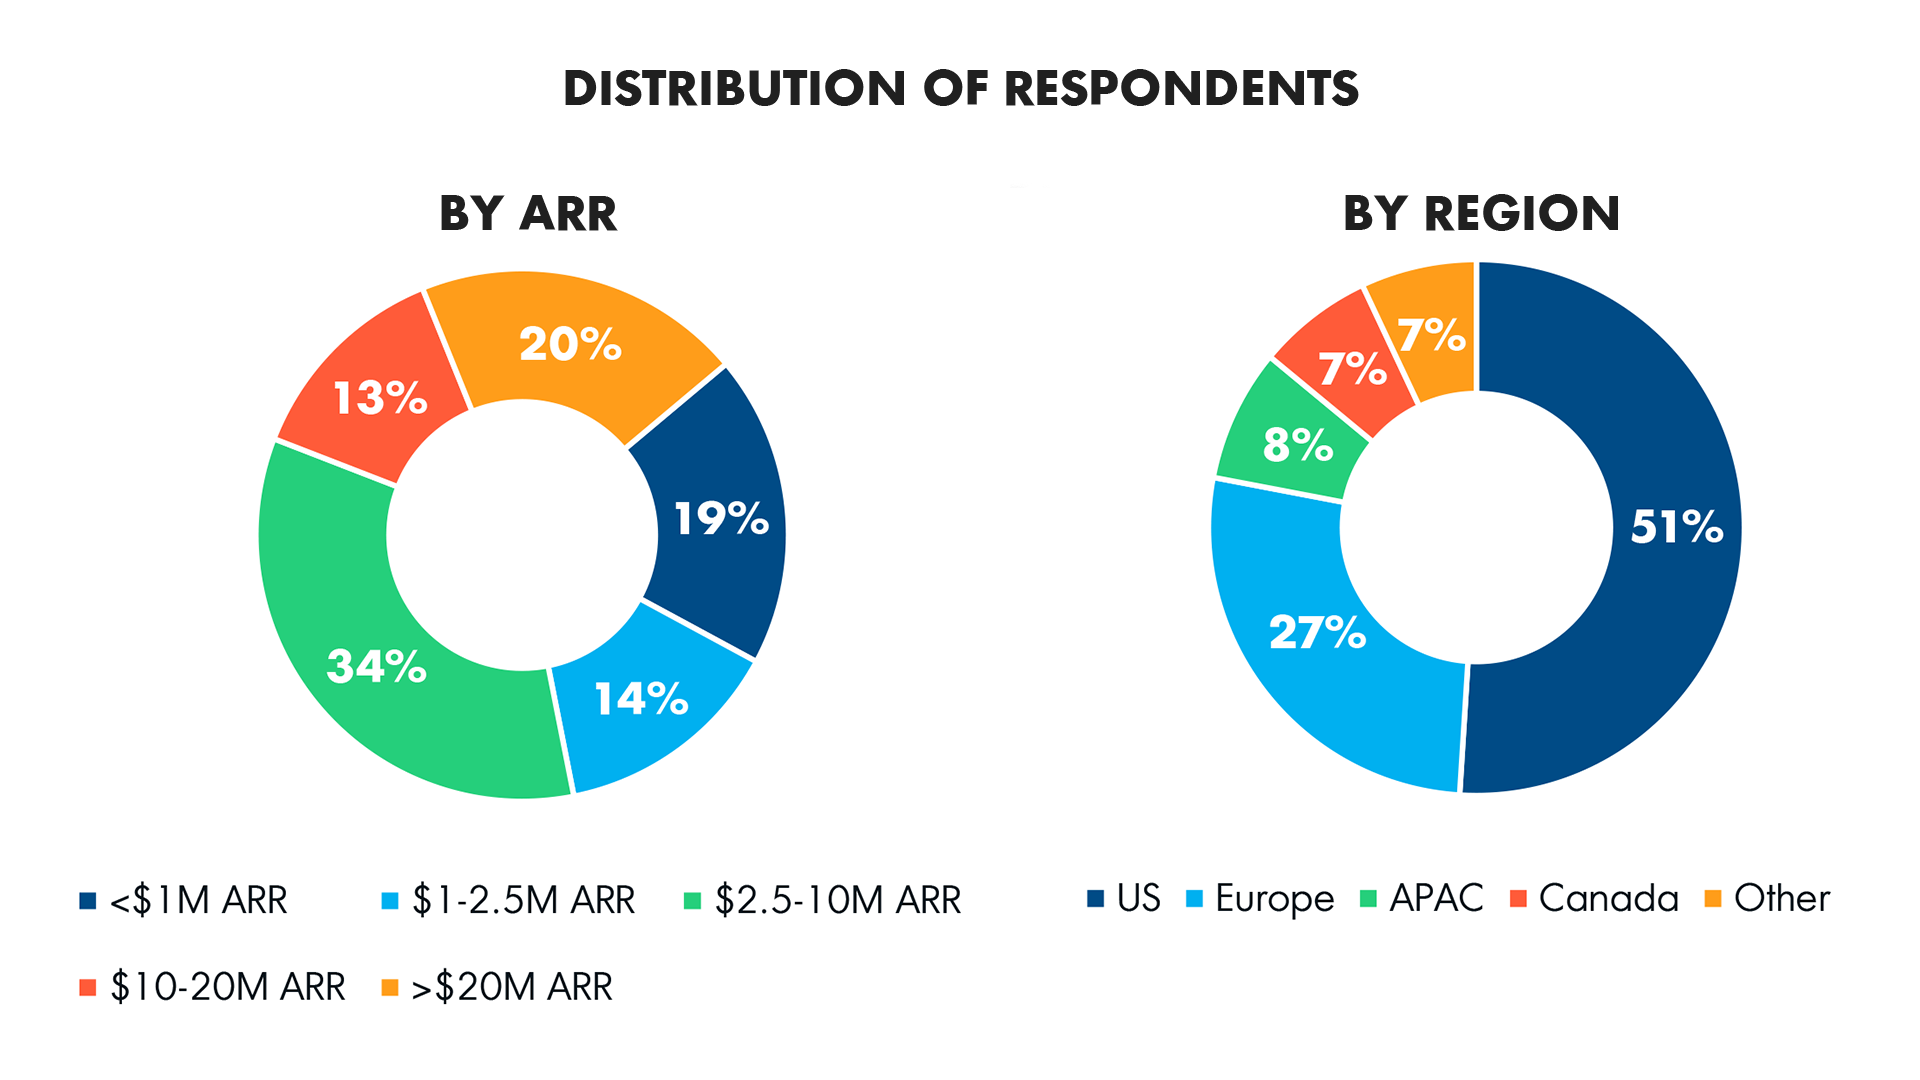
CEOs, founders, CFOs, and VPs of finance as part of OpenView’s 2022 Financial & Operating Benchmarks survey, conducted in July-August 2022. Nearly 3,000 private SaaS companies have participated in this survey across six years.

State of Usage-Based Pricing Respondent Pie Chart

Hybrid pricing models are winningTrophy-02

Today’s software trends mandate charging based on usage, not users: 

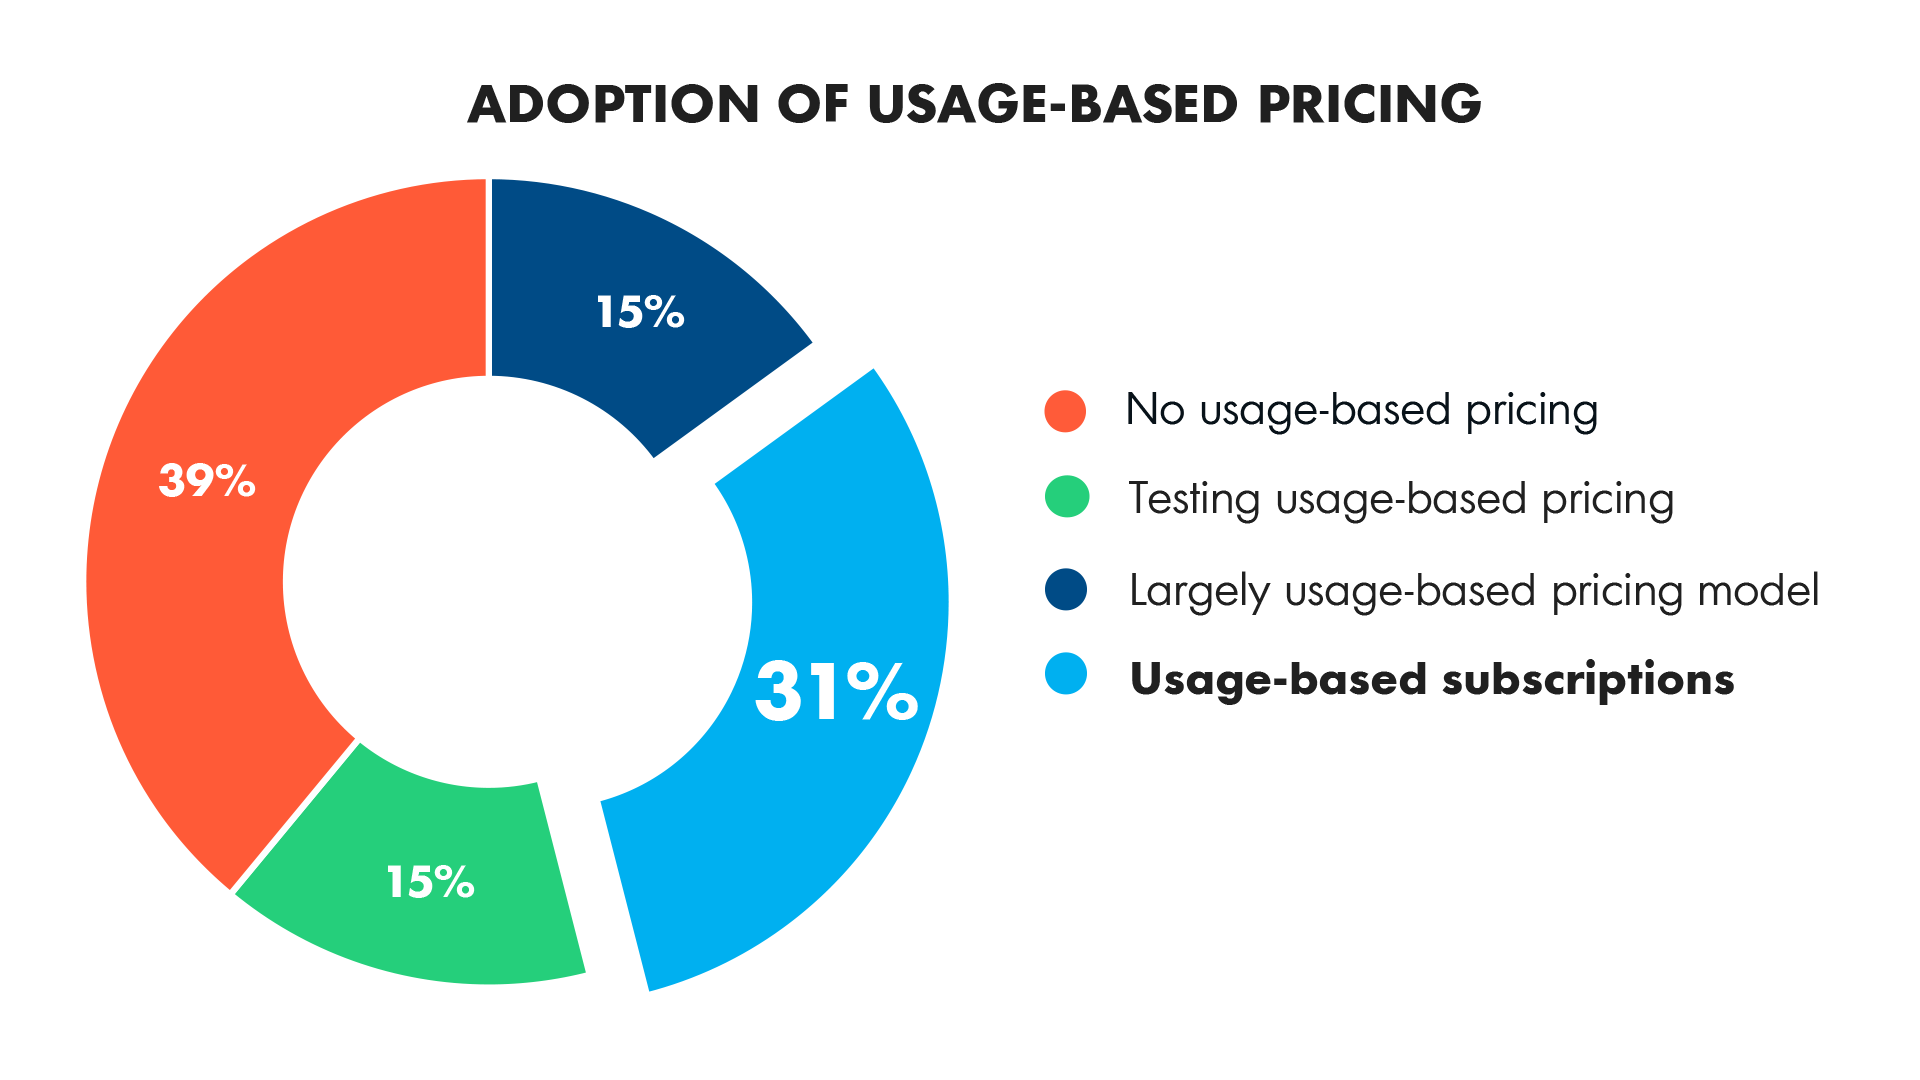
  • Three out of five SaaS companies now use some form of usage-based pricing

  • Usage-based models exist on a spectrum—the most popular model being hybrid usage-based subscriptions

  • The popularity of automations, AI, and developer applications in SaaS means that you don’t need a user to see value – SaaS companies need to move beyond the old per-seat pricing paradigm


Adoption of Usage-based pricing model

A new tech stack has emergedSparkles

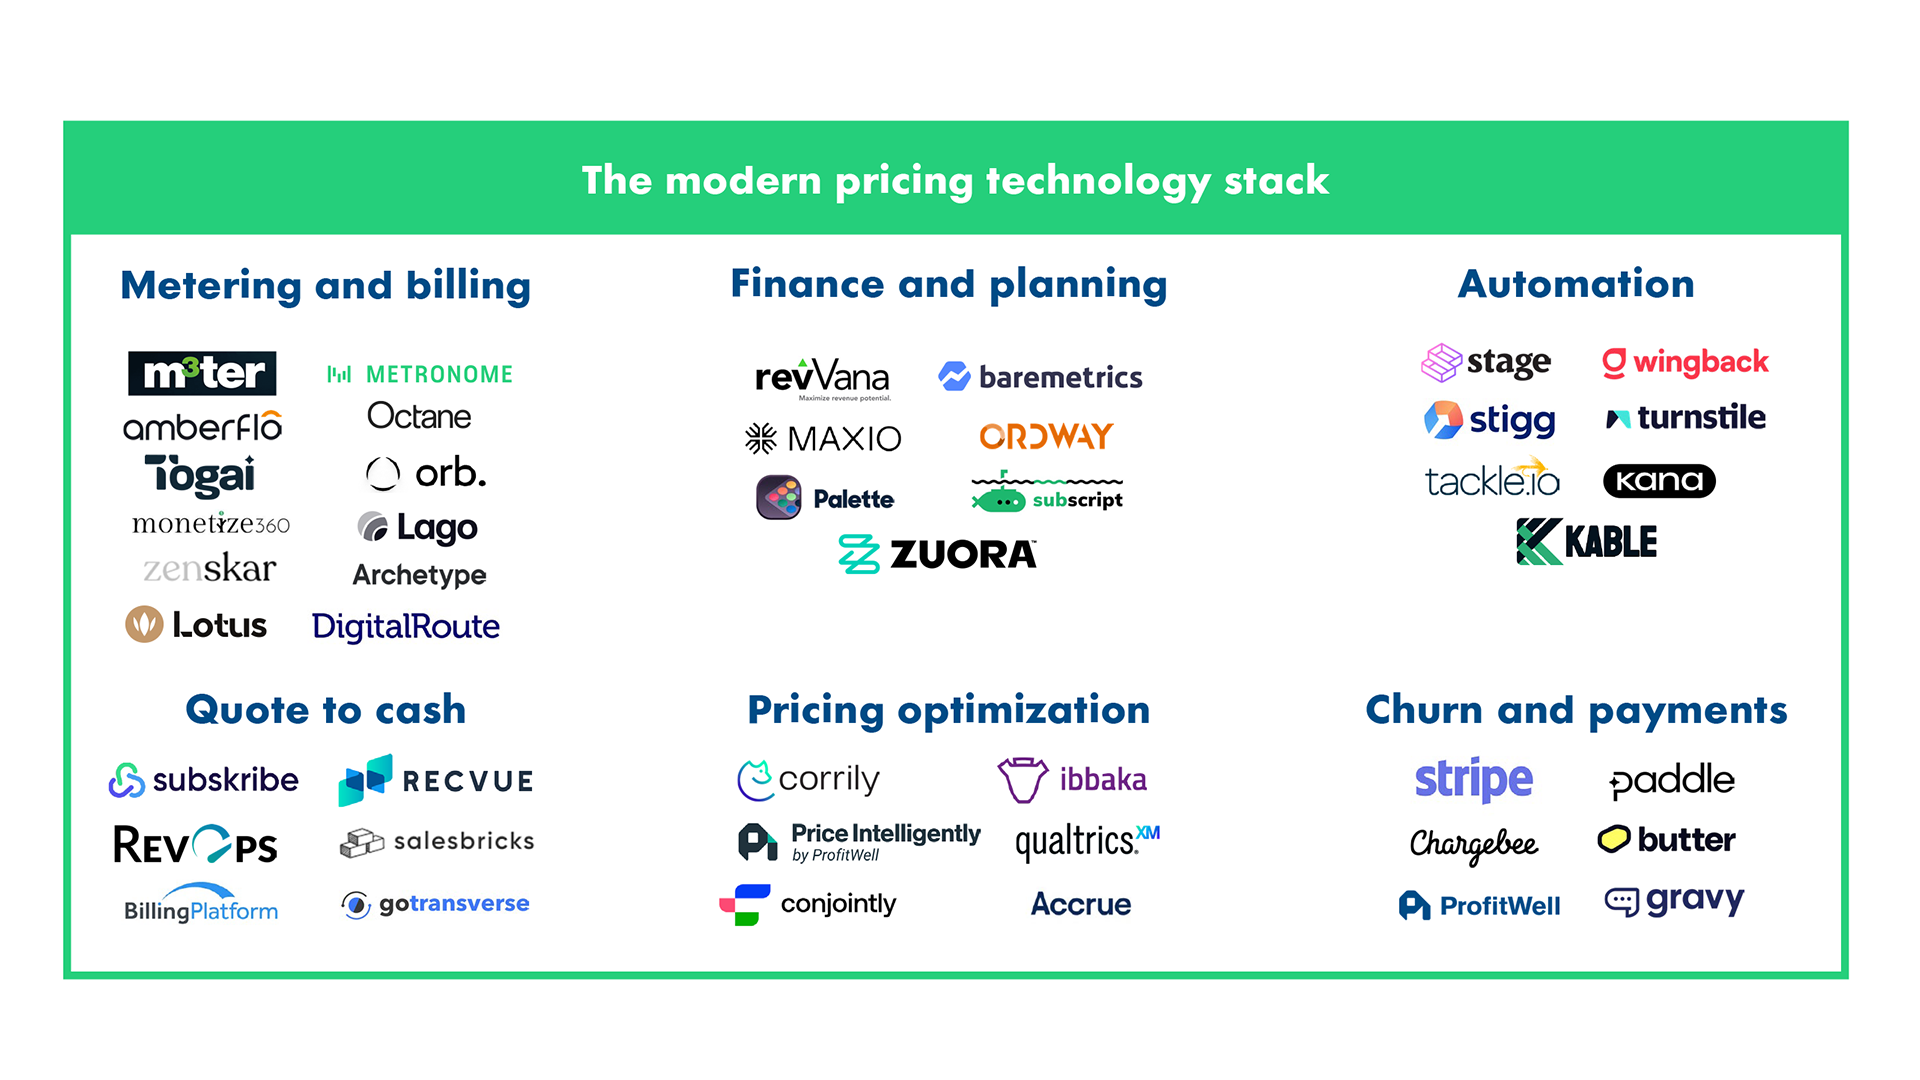
We’re seeing the rise of the modern pricing tech stack:

  • New software categories crop up as businesses need tools to support complex pricing models

  • The rapid proliferation of vendors in these new categories indicates a real demand from SaaS companies looking to implement usage-based models
Modern Tech Stack Infographic

Usage-based companies outperform their peers Clap emoji

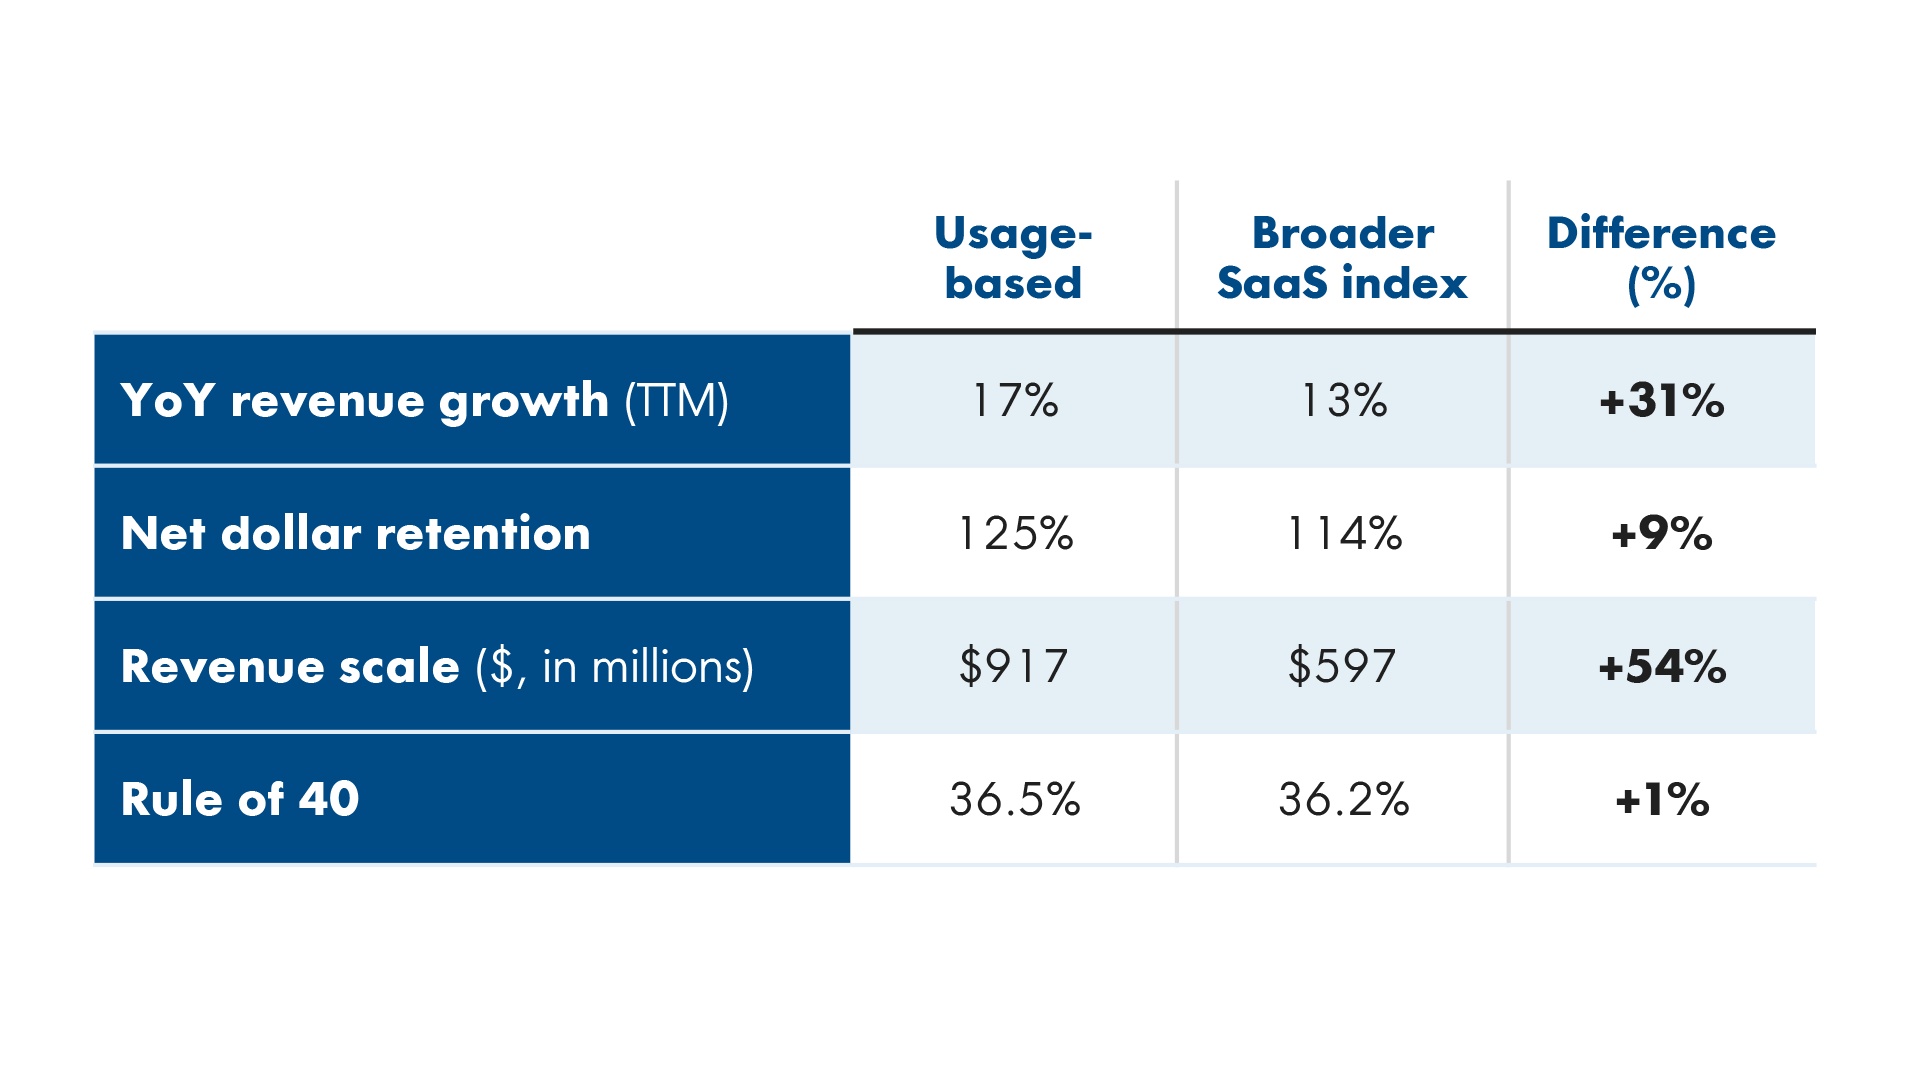
We compare how public usage-based companies stack up against the broader SaaS index:

  • Despite the challenging economic environment, usage-based businesses see comparable growth at scale (17% vs. 13%), driven by best-in-class net retention (125% vs. 114%)

  • They do this at even greater revenue scale with similar gross margin and rule of 40 profiles to their peers
Comparison chart between usage-based pricing companies and broader SaaS index